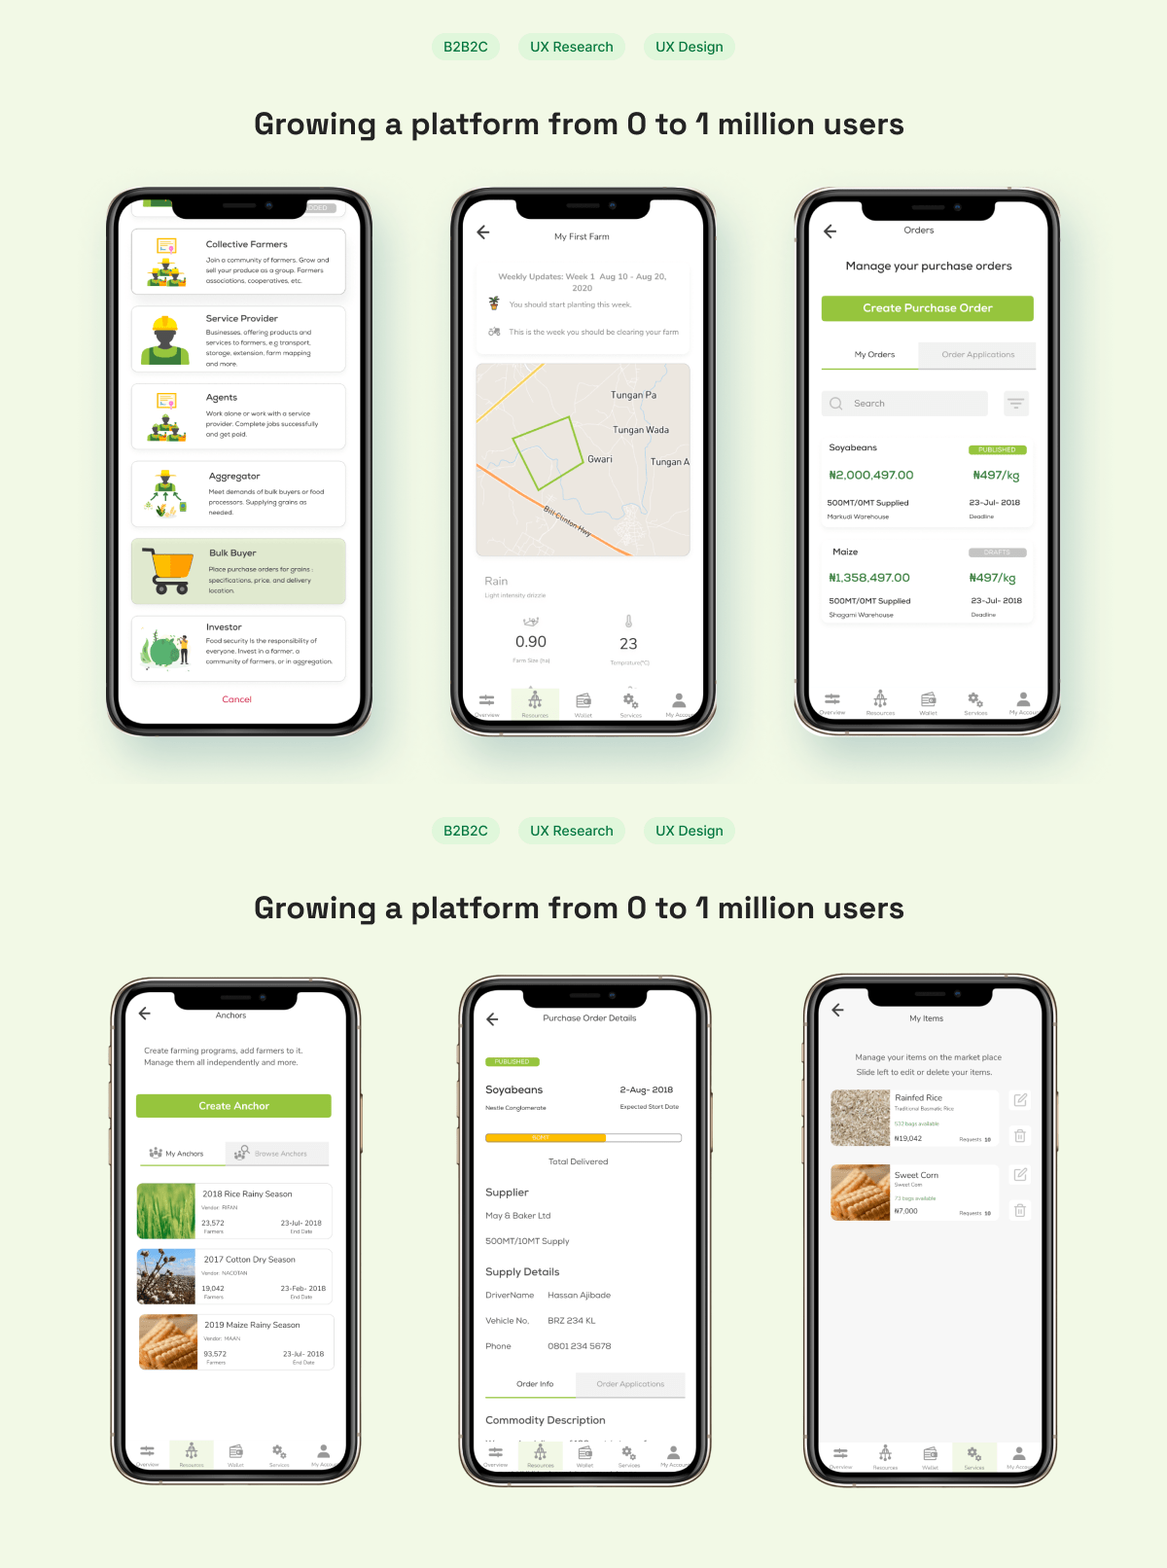
One man design team - working platform wide
1 designer, 1 CTO, 6 engineers
Company
EveryFarmer
Year
2019 - 2022
Deliverables
Web App, Mobile App, UX Research
Tools
Figma, Miro, FigJam, ClickUp
What were we trying to tackle?
We analysed the business problems thus:
- How might we capture real farmers on the platform?
- How might we provide farmers better tools and better farming practice?
- How might we minimise the literacy gap with smallholder farmers?
What were we trying to tackle?
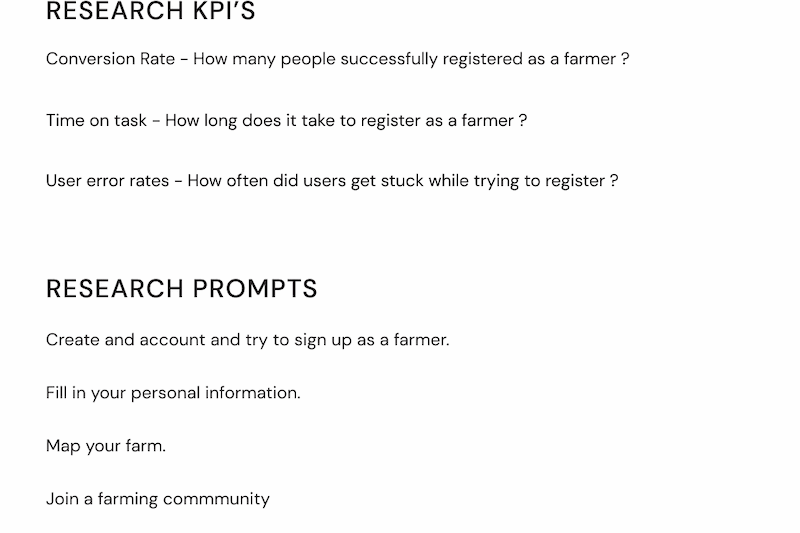
I decided travelled to one of the locations of the farming community to conduct some user research and understand our users better.
I started with a usability test with 5 participants. Here’s a snippet of some information of research plan.
Learnings from the research
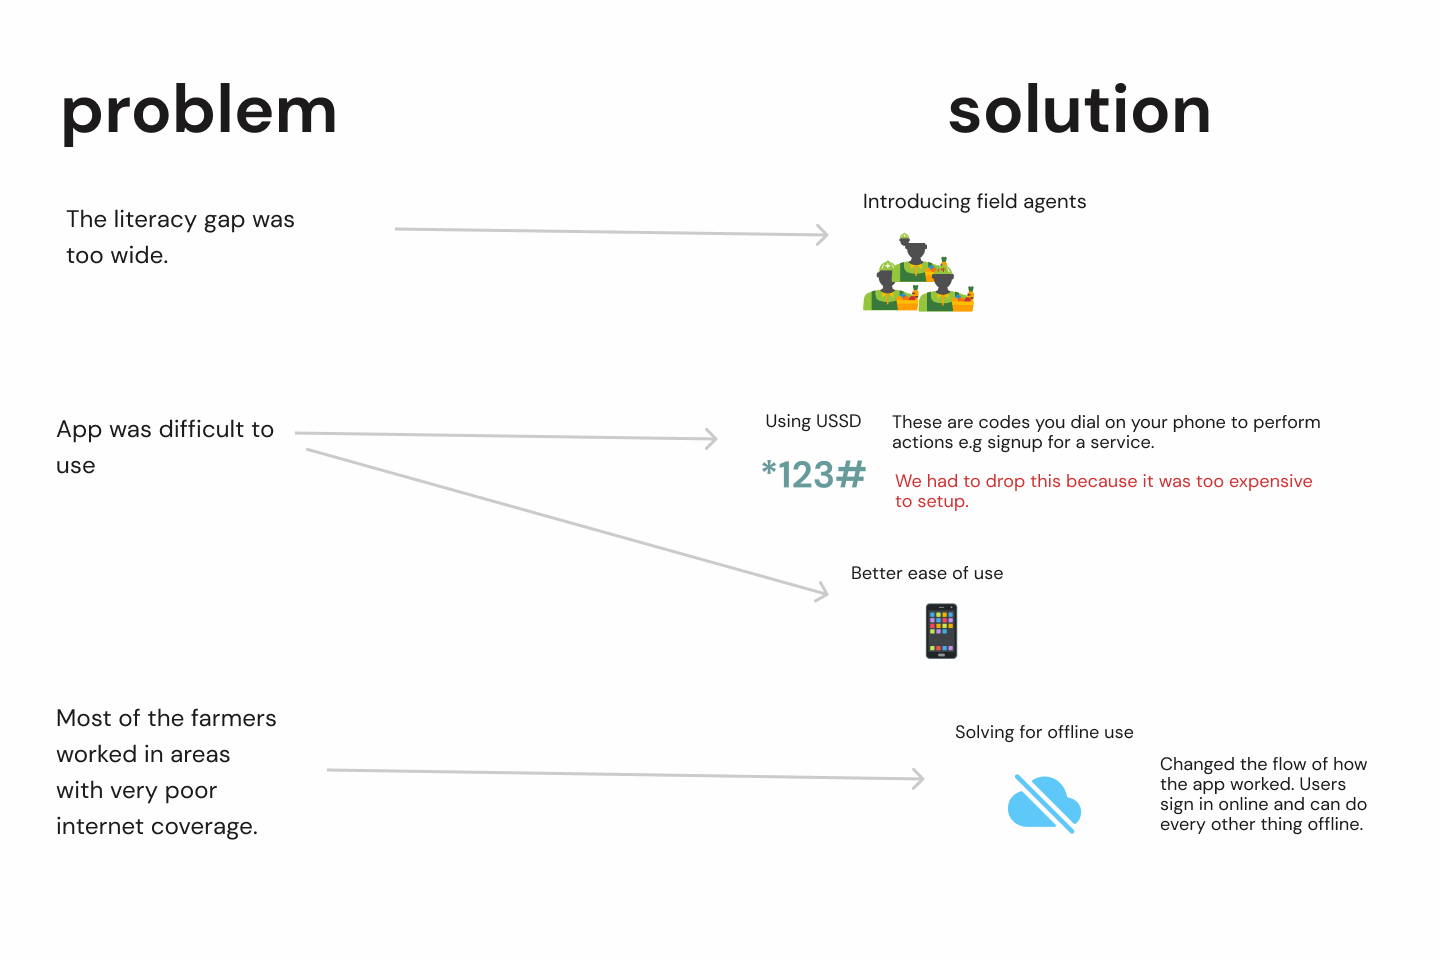
- There’s a very wide literacy gap among the users. Much wider than we assumed.
- Most of the users worked in areas with very poor network coverage.
- Steps for onboarding needs to be simplified throughout the platform.
From this session I came up with different solutions:
- Each one tied to the problems we got from the research insights.
- To solve for the field agents I had to get a role based persona for the field agent.
Who would use this?
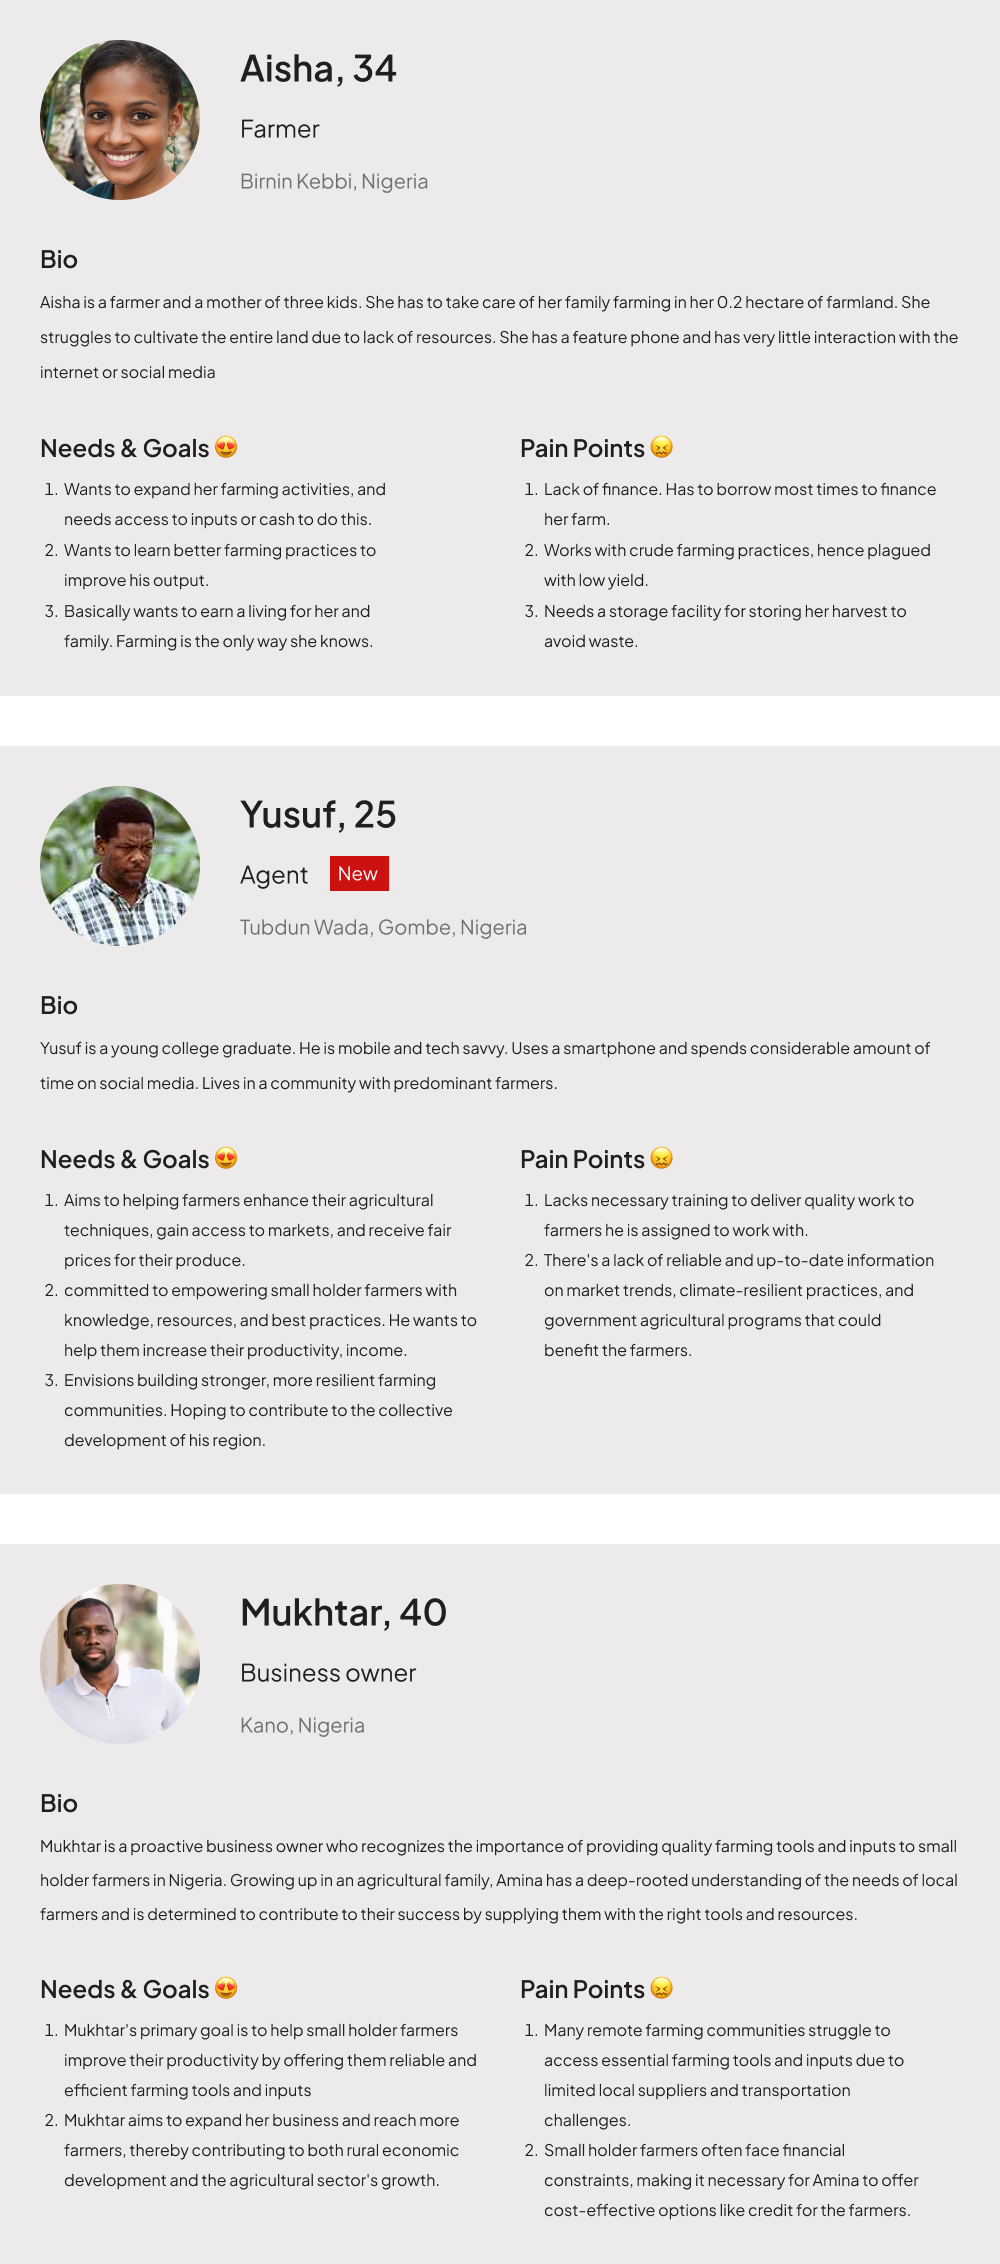
From our learnings, I created user personas for the different kind of users that would interact with the platform. Now introducing field agents Here’s a user persona for a typical field agents that will be introduced to the platform.
The main role of these agents would be to assist the uneducated farmers, help them perform tasks, while also earning from the platform.
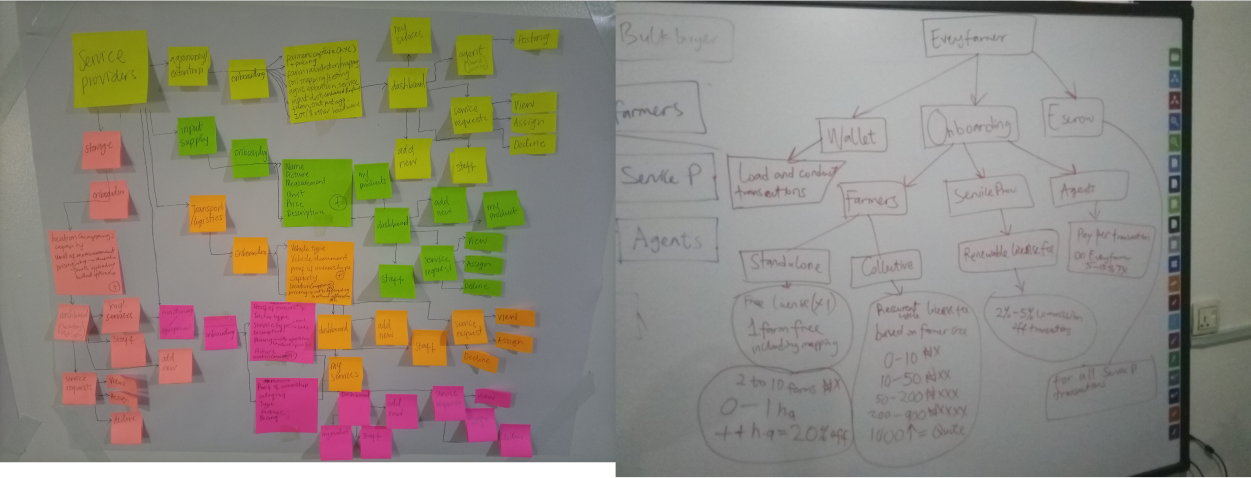
Mapping out how users navigate on the platform
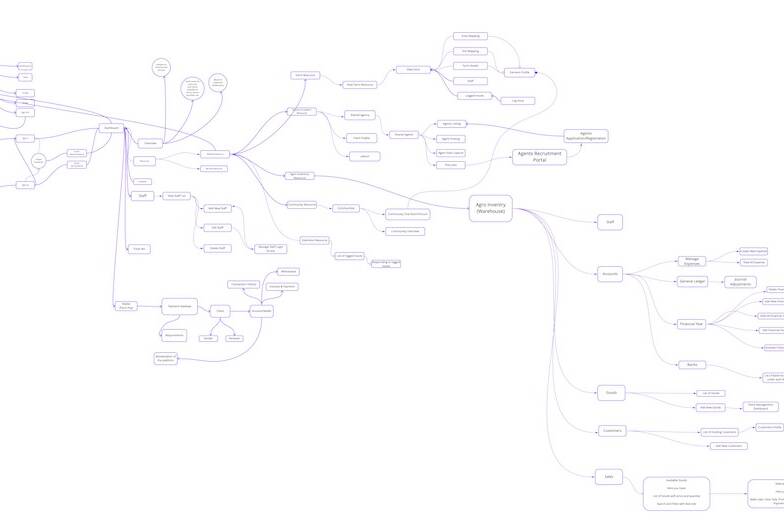
Further breaking down the path for the user, I chose to come up with a detailed information architecture for the farmer and agents.
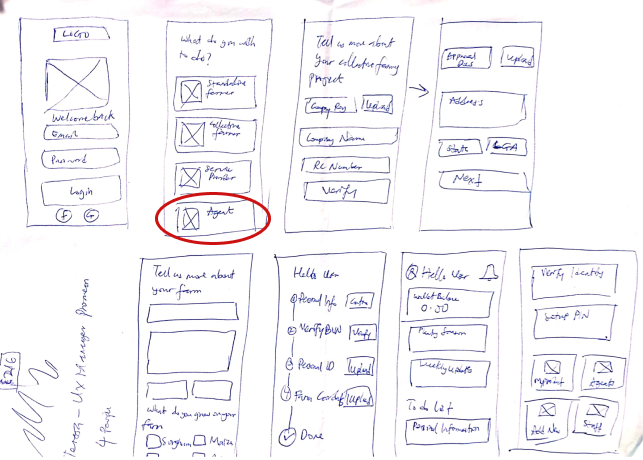
Sketching the new ideas
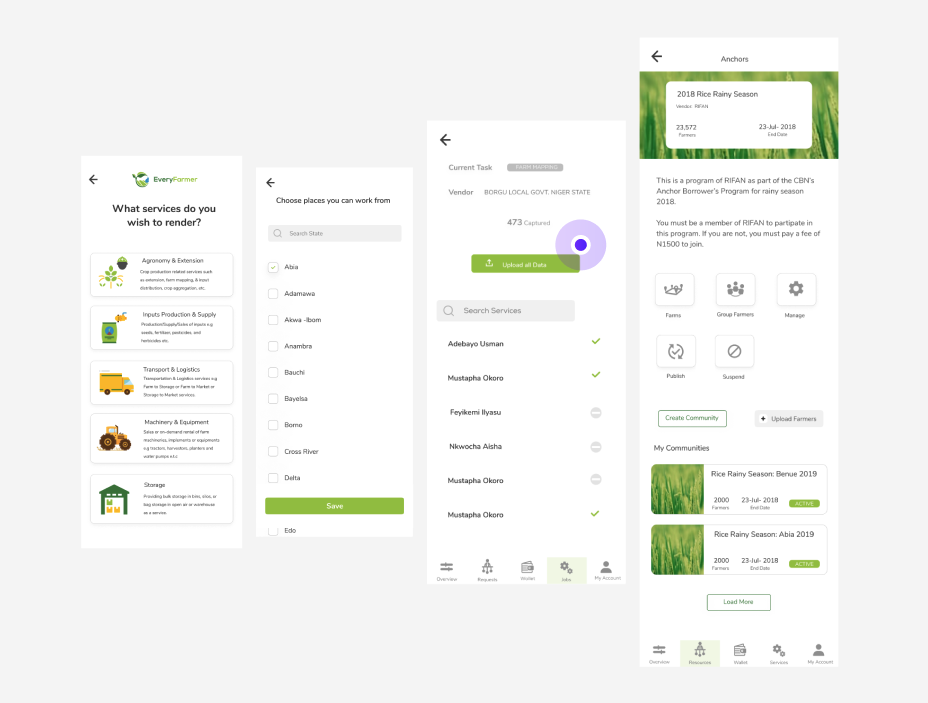
To test out the ideas and have a feel of what it would look like, I then drafted wireframes. The red circle in the screen below indicates the agents role introduced to the platform.
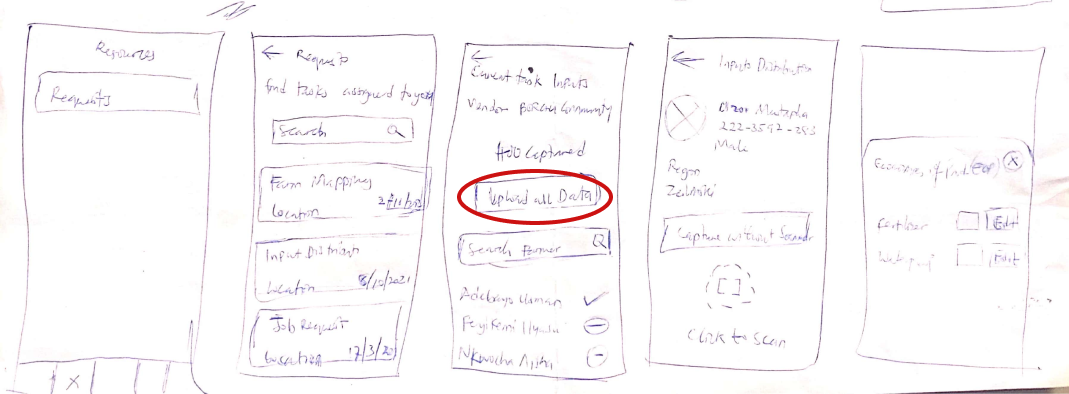
The red circle in the wireframe below indicates the “Upload all Data” button. This is to be used to upload data after working offline.
Testing the new solution
The first set of the solution was test with a closed focus group comprising of farmer and field agents
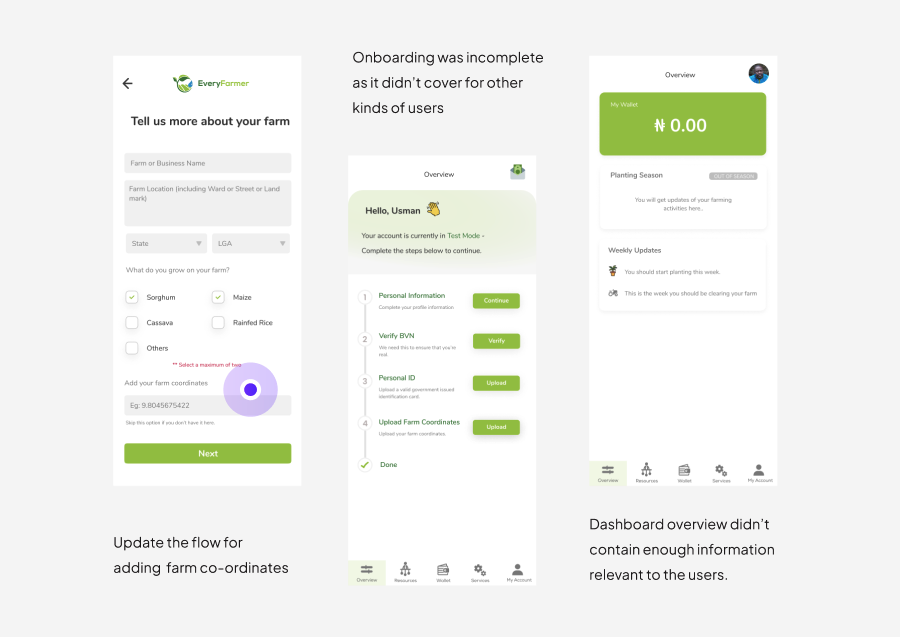
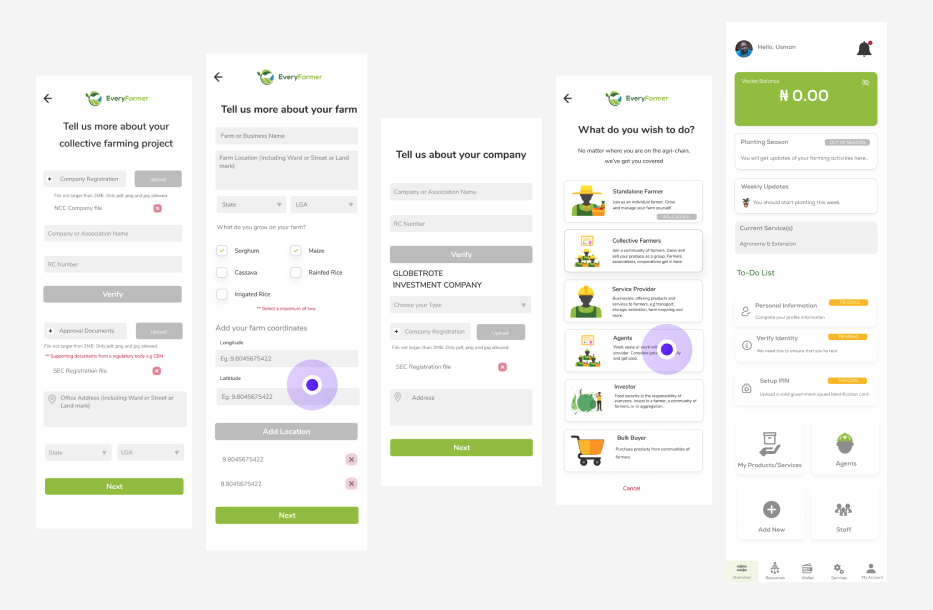
- We updated the input fields for adding farm co-ordinates – Splitting it into 2 for longitude and latitude.
- Updated the onboarding flow to now cater for the different sets of users – farmers, service providers, agents.
- Also updated the dashboard overview to contain extra information e.g check list for users to complete registration, and navigation to other features.
Final product
Some notable changes include:
- We introduced a new set of user the Field agents.
- We also worked to change the flow of how the app worked.
- Users would need internet access to login for the first time, the the app downloads every information they would need. They can now perform actions like mapping farms, data collection etc.
- The users can now upload all the captured data anytime they get an internet connection.
Our results and impact
As at Q4 2021, we had achieved the following
1,000,000+
Total smallholder farmers onboarded on the platform with about 20% active users.
3000+
Total field agents that performed transactions on the platform
Takeaways
- A lot of value can be captured when you connect the dots for farmers to have access to all they need to function.
- The platform has too many moving parts and we tried to do too many things at the same time, with a small team.
- I learned to prioritise based on what product needs to grow, clients expectations, and team budget.

